An item of interest to linguists is vowel overlap, or how much two categories of vowels overlap in a language. Though there are a number of cues that help distinguish one vowel the first two formants, F1 and F2, as well as the duration of the vowel, are the most prominent.
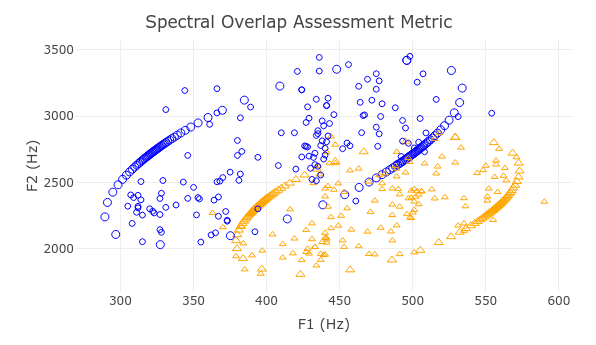
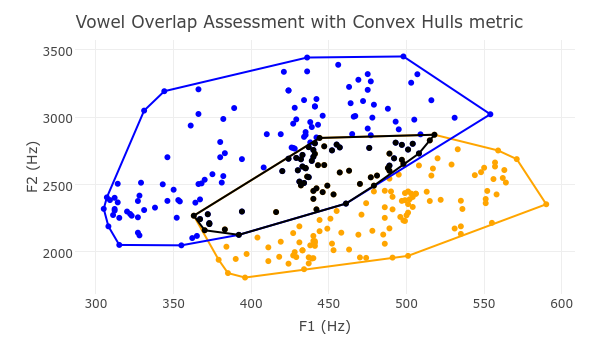
The question is how to use F1, F2, and, optionally, duration to calculate the overlap between two vowel categories. There have been a small number of metrics published that seek to quantify vowel overlap, such as Alicia Wassink’s Spectral Overlap Assessment Metric, Geoffrey Stewart Morrison’s a posteriori probability metric, and Erin F. Haynes and Michael Taylor’s Vowel Overlap Assessment with Convex Hulls metric. Despite these metrics having existed for some time, there has not been a robust comparison between them to determine which of them, if any, is the most accurate and precise.
Matthew C. Kelley, Geoffrey Stewart Morrison, and Benjamin V. Tucker are collaborating to prepare a robust comparison of these metrics using Monte Carlo simulation to test them for how accurate they are and how precise they are, as well as whether there are situations in which one if preferable over the other. In the spirit of open science, we will also be releasing our implementations of each of these metrics in the R programming language so that researchers will have easy access to using these metrics. Each implementation will also include visualization capabilities appropriate to each metric.
Having a vowel overlap metric that is accurate and precise will be a boon to a number of fields, such as dialectology and sociophonetics in studying vowel merger and variation, as well as in second language speech learning, to help language learners and users more closely match the vowel targets in their target language.
Sample visualizations of the overlap metrics run on Hillenbrand /i/ and /ɪ/ data can be seen below.